Talk:Matlab:Gradual dimming population model: Difference between revisions
Jump to navigation
Jump to search
m (Created page with "Can I get a few extra simulations with the below values? #1 C = 10; % Number of girls contracted by QBe D = 0.01; % Proportion of girls (who are fighting) that die B = 0.1...") |
Homerun-chan (talk | contribs) (→Another interresting result: new section) |
||
| (6 intermediate revisions by 2 users not shown) | |||
| Line 1: | Line 1: | ||
Can I get a few extra simulations with the below values? | Can I get a few extra simulations with the below values? | ||
==First try== | |||
<pre> | |||
C = 10; % Number of girls contracted by QBe | C = 10; % Number of girls contracted by QBe | ||
D = 0.01; % Proportion of girls (who are fighting) that die | D = 0.01; % Proportion of girls (who are fighting) that die | ||
| Line 12: | Line 14: | ||
M(1) = 0; % Number of magical girls at first | M(1) = 0; % Number of magical girls at first | ||
W(1) = 0; % Number of witches at first | W(1) = 0; % Number of witches at first | ||
</pre> | |||
==Result== | |||
<gallery> | |||
File:Matlab talkpage result 1.png | |||
File:Matlab talkpage result 1 logscale.png|The result where y is in log scale | |||
</gallery> | |||
{{-}} | |||
==Second try== | |||
<pre> | |||
C = 10; % Number of girls contracted by QBe | |||
D = 0.01; % Proportion of girls (who are fighting) that die | |||
B = 0.1; % Proportion of girls (who are fighting) to become witches | |||
F = 0.05; % Proportion of familiars becoming witches | |||
K = 0.2; % Proportion of witches getting killed by MSes | |||
P = 0.95; % proportion of MSes fightgins | |||
T = 0.0001; % Number of MSes turning into witches over time | |||
M(1) = 0; % Number of magical girls at first | |||
W(1) = 0; % Number of witches at first | |||
</pre> | |||
==Result== | |||
<gallery> | |||
File:Matlab talkpage result 2.png | |||
File:Matlab talkpage result 2 logscale.png|the result in log scale | |||
</gallery> | |||
{{-}} | |||
==Third try== | |||
<pre> | |||
C = 10; % Number of girls contracted by QBe | |||
D = 0.01; % Proportion of girls (who are fighting) that die | |||
B = 0.1; % Proportion of girls (who are fighting) to become witches | |||
F = 0.5; % Proportion of familiars becoming witches | |||
K = 0.2; % Proportion of witches getting killed by MSes | |||
P = 0.95; % proportion of MSes fightgins | |||
T = 0.01; % Number of MSes turning into witches over time | |||
M(1) = 0; % Number of magical girls at first | |||
W(1) = 0; % Number of witches at first | |||
</pre> | |||
==Result== | |||
<gallery> | |||
File:Matlab talkpage result 3.png | |||
File:Matlab talkpage result 3 logscale.png|result 3 in log scale | |||
</gallery> | |||
== Another interresting result == | |||
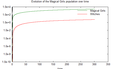
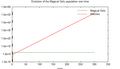
Here's another result. Third model, in the case K>B+F. | |||
The value at which the system seems to become unstable seems to be around t=0.0003595. I have absolutely no clue about such a behavior ... | |||
Also note that reducing T has the effect of reducing the first gap's length, the others don't seem to vary that much ... | |||
[[File:Population dynamics with varrying T.png|thumb|800px|left|Left is with T=0.000359, the system seems to converge to its equilibrium. Right is with T=0.0003596, the system goes crazy as usual.]] | |||
Latest revision as of 18:07, 20 March 2011
Can I get a few extra simulations with the below values?
First try
C = 10;    % Number of girls contracted by QBe
D = 0.01;    % Proportion of girls (who are fighting) that die
B = 0.1;   % Proportion of girls (who are fighting) to become witches
F = 0.5;   % Proportion of familiars becoming witches
K = 0.2;  % Proportion of witches getting killed by MSes
P = 0.95;   % proportion of MSes fightgins
T = 0.0001; % Number of MSes turning into witches over time

M(1) = 0;   % Number of magical girls at first
W(1) = 0;   % Number of witches at first
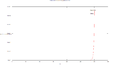
Result
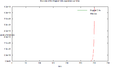
The result where y is in log scale


Second try
C = 10;    % Number of girls contracted by QBe
D = 0.01;    % Proportion of girls (who are fighting) that die
B = 0.1;   % Proportion of girls (who are fighting) to become witches
F = 0.05;   % Proportion of familiars becoming witches
K = 0.2;  % Proportion of witches getting killed by MSes
P = 0.95;   % proportion of MSes fightgins
T = 0.0001; % Number of MSes turning into witches over time

M(1) = 0;   % Number of magical girls at first
W(1) = 0;   % Number of witches at first
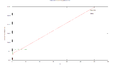
Result
the result in log scale


Third try
C = 10;    % Number of girls contracted by QBe
D = 0.01;    % Proportion of girls (who are fighting) that die
B = 0.1;   % Proportion of girls (who are fighting) to become witches
F = 0.5;   % Proportion of familiars becoming witches
K = 0.2;  % Proportion of witches getting killed by MSes
P = 0.95;   % proportion of MSes fightgins
T = 0.01; % Number of MSes turning into witches over time

M(1) = 0;   % Number of magical girls at first
W(1) = 0;   % Number of witches at first
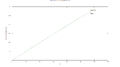
Result
result 3 in log scale


Another interresting result
Here's another result. Third model, in the case K>B+F. The value at which the system seems to become unstable seems to be around t=0.0003595. I have absolutely no clue about such a behavior ...
Also note that reducing T has the effect of reducing the first gap's length, the others don't seem to vary that much ...
