Sales Analysis
BD/DVD SALES ANALYSIS
This page covers the sales data for Madoka BD/DVD sales and using historical information from other top-selling anime. As more data becomes available, new analysis is added to evaluate Madoka's future volume 1 and average volume sales to evaluate the likelihood of it becoming the top-selling late night TV anime since 2000.
Current Running Total of Madoka BD/DVD Sales
Source: [1] Click on "show" at the right of each of the tables for more detailed information.
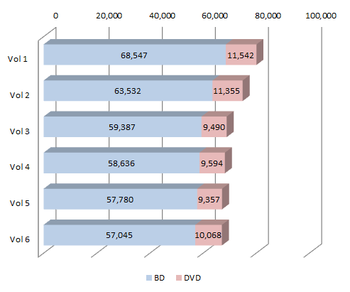
| Volume 1 (released April 27, 2011) Last updated on: January 30, 2014
| ||||||||||||||||||||||||||||||||||||||||||||||||||||||||||||||||||||||||||||||
|---|---|---|---|---|---|---|---|---|---|---|---|---|---|---|---|---|---|---|---|---|---|---|---|---|---|---|---|---|---|---|---|---|---|---|---|---|---|---|---|---|---|---|---|---|---|---|---|---|---|---|---|---|---|---|---|---|---|---|---|---|---|---|---|---|---|---|---|---|---|---|---|---|---|---|---|---|---|---|
| BD Total: | 68,547 | |||||||||||||||||||||||||||||||||||||||||||||||||||||||||||||||||||||||||||||
| DVD Total: | 11,542 | |||||||||||||||||||||||||||||||||||||||||||||||||||||||||||||||||||||||||||||
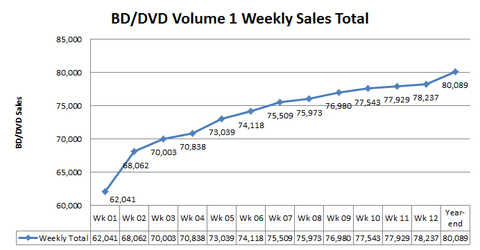
| Running total: | 80,089 | |||||||||||||||||||||||||||||||||||||||||||||||||||||||||||||||||||||||||||||
| ||||||||||||||||||||||||||||||||||||||||||||||||||||||||||||||||||||||||||||||
| Volume 2 (released May 25, 2011) Last updated on: January 30, 2014
| ||||||||||||||||||||||||||||||||||||||||||||||||||||||||||
|---|---|---|---|---|---|---|---|---|---|---|---|---|---|---|---|---|---|---|---|---|---|---|---|---|---|---|---|---|---|---|---|---|---|---|---|---|---|---|---|---|---|---|---|---|---|---|---|---|---|---|---|---|---|---|---|---|---|---|
| BD Total: | 63,532 | |||||||||||||||||||||||||||||||||||||||||||||||||||||||||
| DVD Total: | 11,355 | |||||||||||||||||||||||||||||||||||||||||||||||||||||||||
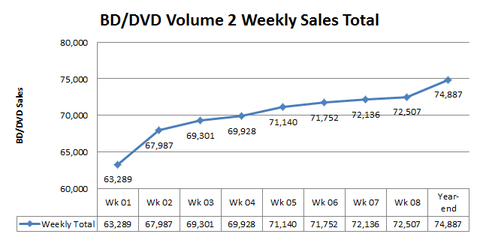
| Running total: | 74,887 | |||||||||||||||||||||||||||||||||||||||||||||||||||||||||
| ||||||||||||||||||||||||||||||||||||||||||||||||||||||||||
| Volume 3 (released June 22, 2011) Last updated on: January 30, 2014
| |||||||||||||||||||||||||||||||||||||||||||
|---|---|---|---|---|---|---|---|---|---|---|---|---|---|---|---|---|---|---|---|---|---|---|---|---|---|---|---|---|---|---|---|---|---|---|---|---|---|---|---|---|---|---|---|
| BD Total: | 59,387 | ||||||||||||||||||||||||||||||||||||||||||
| DVD Total: | 9,490 | ||||||||||||||||||||||||||||||||||||||||||
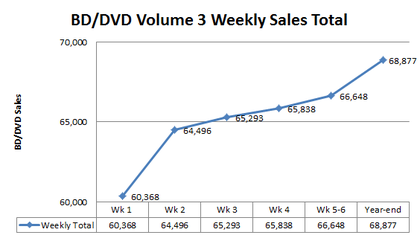
| Running total: | 68,877 | ||||||||||||||||||||||||||||||||||||||||||
| |||||||||||||||||||||||||||||||||||||||||||
| Volume 4 (released July 27, 2011) Last updated on: January 30, 2014
| ||||||||||||||||||||||||||||||||||||||||||||||||||||||||||
|---|---|---|---|---|---|---|---|---|---|---|---|---|---|---|---|---|---|---|---|---|---|---|---|---|---|---|---|---|---|---|---|---|---|---|---|---|---|---|---|---|---|---|---|---|---|---|---|---|---|---|---|---|---|---|---|---|---|---|
| BD Total: | 58,636 | |||||||||||||||||||||||||||||||||||||||||||||||||||||||||
| DVD Total: | 9,594 | |||||||||||||||||||||||||||||||||||||||||||||||||||||||||
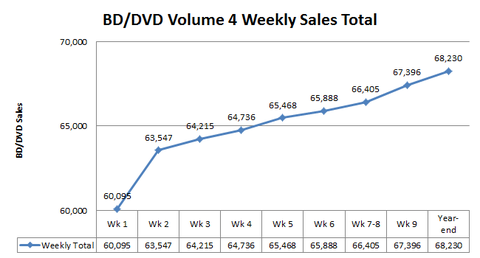
| Running total: | 68,230 | |||||||||||||||||||||||||||||||||||||||||||||||||||||||||
| ||||||||||||||||||||||||||||||||||||||||||||||||||||||||||
| Volume 5 (released August 24, 2011) Last updated on: January 30, 2014
| ||||||||||||||||||||||||||||||||||||||||||||||||
|---|---|---|---|---|---|---|---|---|---|---|---|---|---|---|---|---|---|---|---|---|---|---|---|---|---|---|---|---|---|---|---|---|---|---|---|---|---|---|---|---|---|---|---|---|---|---|---|---|
| BD Total: | 57,780 | |||||||||||||||||||||||||||||||||||||||||||||||
| DVD Total: | 9,357 | |||||||||||||||||||||||||||||||||||||||||||||||
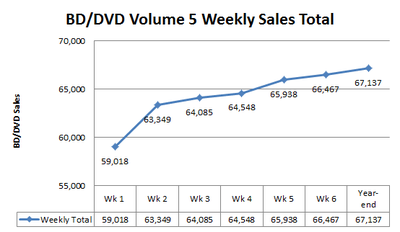
| Running total: | 67,137 | |||||||||||||||||||||||||||||||||||||||||||||||
| ||||||||||||||||||||||||||||||||||||||||||||||||
| Volume 6 (released September 21, 2011) Last updated on: January 30, 2014
| ||||||||||||||||||||||||||||||||||||||||||||||||
|---|---|---|---|---|---|---|---|---|---|---|---|---|---|---|---|---|---|---|---|---|---|---|---|---|---|---|---|---|---|---|---|---|---|---|---|---|---|---|---|---|---|---|---|---|---|---|---|---|
| BD Total: | 57,045 | |||||||||||||||||||||||||||||||||||||||||||||||
| DVD Total: | 10,068 | |||||||||||||||||||||||||||||||||||||||||||||||
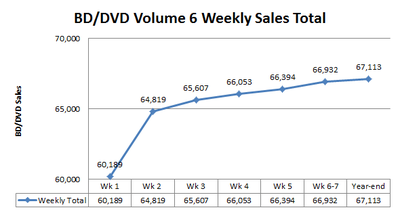
| Running total: | 67,113 | |||||||||||||||||||||||||||||||||||||||||||||||
| ||||||||||||||||||||||||||||||||||||||||||||||||
For perspective on sales: The Manabi line "breaking point" is approximately 3,000 per volume for an anime to pay for itself in volume sales (this doesn't count other sources of revenue like product sales). For Madoka with six volumes, that would be 18,000 sales. In the very first week of the first volume sales of 62,041, Madoka paid for itself more than three times over for all of its volumes. It actually more than paid for all six volumes in just the BD (22,000) sales on its first day, which is more than what many anime sell in an entire year.
Note: Week of July 18 to July 24, 2011, BD Volumes 1 through 3 did not rank for the first time. This is not unusual where anime sales dip too low to be reported or are simply eclipsed by other anime sales to make rankings. For a high-seller like Madoka, the missing sales will be accounted with an end-of-year adjustment. Also, it's likely that the volume sales will increase again to make rankings once more, probably as soon as next week with the release of BD Volume 4 numbers.
Projections of Follow-on Sales for Volume 1, Based on Top 15 Selling Anime
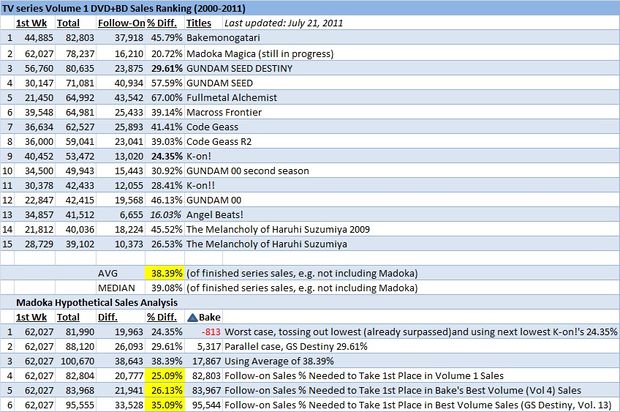
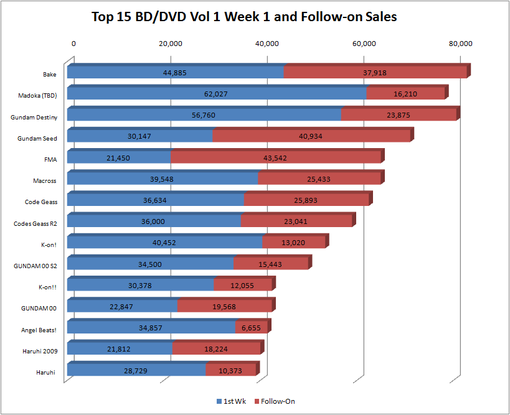
The following data is used to analyze the likelihood of Madoka taking over the number one spot from the current leader, Bakemonogatari (Bake) for volume 1 BD/DVD sales. This is specifically for a late night TV anime that started their sales since 2000, since sales reporting because less accurate the further back in time as well as major differences in the sales environment. It does not include movie sales, mainstream anime sales or sales of anime prior to 2000. The table shows: Volume 1 first week sales, total sales, the difference in number of sales for the top 15 ranked, and the difference in sales from first week to total sales, then calculated averages. When the data is presented in a graph, Madoka stands out as unusually high in first volume sales with significant growth potential in follow-on sales to catch up with its peers.
Note: This chart only covers up to the winter season anime, and does not include recent data from the spring season.
From what we've seen, Madoka might be on the lower end of the growth side of sales so a conservative estimate would be to use the average listed as the highest reasonable estimate and the lowest figure not already surpassed by Madoka (e.g. Angel Beats) as the lowest reasonable average. If using the lowest figure by K-on!, Madoka would be close but not surpass Bake's record. If using Gundam Seed Destiny, which also had a very high first week and relatively slow follow-on sales, as a parallel case to come up with a number, it which would put Madoka comfortably in the lead. The analysis also compares Bake's best volume sales which was 83,967 for vol. 4, a figure only slightly higher than its volume 1 sales. It would also be a record Madoka could reasonably surpass. It is even possible, if Madoka were to meet the average sales percentage, for it to overtake the best volume sales record set by Gundam Seed's Destiny volume 13.
Ten Week Comparison of Bakemonogatari vs. Madoka Volume 1 Sales
Sources: Bakemonogatari [6], Madoka[7]
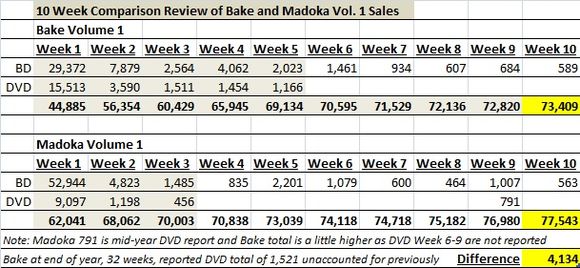
This analysis examines the data at the 10 week sales mark between Bake Vol. 1 and Madoka's Vol. 1. When Bake Vol. 1 was released, there were problems initially with supply constraints. So first week sales were less than it should have been with some very high early week sales following it as distributors struggled to meet demand. To put the two on equal footing, weeks are greyed out in the chart to cover a comparative "initial sale" period for Bake (5 weeks) and Madoka (3 weeks) where they end up both close to one another at the 70K mark. What's interesting is looking at follow-on sales after that, Madoka is outpacing Bake, currently 4K ahead of it in sales at week 10. This confirms a very high likelihood of Madoka exceeding Bake Vol 1. later this year.
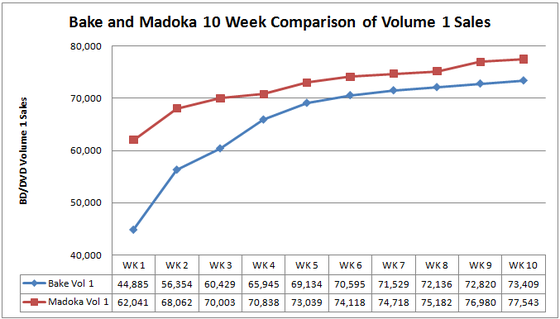
Note: there's a few weeks when Bake DVD sales weren't reported and make up some part of the 1,521 later reported for the year. But since it's impossible to know what percentage of that number is covered in the unreported 5 weeks, I left it out of the calculation. Even assuming a generous number, Madoka would still be thousands ahead of Bake in sales.
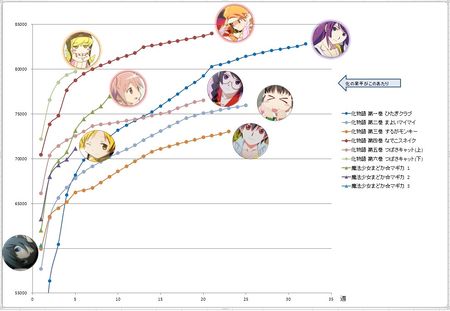
Bakemonogatari vs. Madoka Sales Chart for All Volumes
Source: [8]
This 2ch Sales Chart, which shows up to end of June 2011 data, compares the first three Madoka volumes to Bake's six. It's read as follows:
- X-axis is weeks of sales, Y axis is numbers of sales for both BD and DVD
- Legend - First six lines are Bake Volumes 1-6 in order (lines with circles). Last three are Madoka Volumes 1-3 in order (lines with triangles). Volume 3 only has one data point at the end of June, so no line.
The graph shows that the three Madoka volumes initial sales are in between Bake volumes in first week sales, with a significantly greater slope/trajectory rate of sales in subsequent weeks for Madoka volumes 1 and 2 in comparison to Bake's volume 1 and 2. Even assuming Madoka's sales slope becomes significantly reduced, it still projects a high likelihood of surpassing volume 1 and even Bake's highest volume 4 if the length of sales is comparable to Bake's volume 1. Currently, there's no reason to believe Madoka won't do so, as it is common for first volumes of popular series to have a long run of sales. The same is notable with Madoka's volume 2, which appears to be on track of easily beating at least three of Bake's other volumes, possibly more depending on its length and trajectory of sales. Volume 3 we don't have any real data to work with, except that its initial sales help show Madoka's initial volume sales tend to be clustered rather than the more scattered sales of Bake volumes. The conclusion we can derive from this preliminary data is a very early projection that Madoka is on track to beating Bake in overall sales. However, it's still early on in the sales process so this is far from being definitive.
Post-2000 TV Anime with 30K+ Avg Sales for All Volumes: Comparing First Week to Follow-On Sales
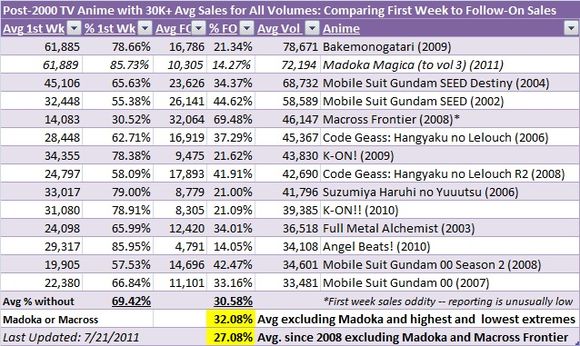
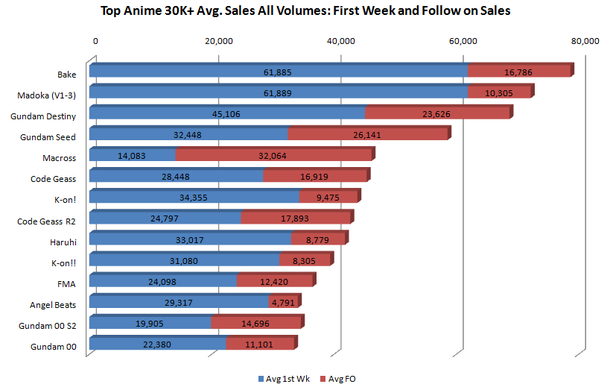
This list was made of TV anime completed series--with the exception of Madoka for comparison purposes--that had sales between 2000 and 2011, which averaged 30K or more for all volumes. This analysis looked at the sales of the anime to see what the average percentage of sales were made in the first week for all volumes versus "follow-on" sales made in the weeks afterwards. These are initial sales following the TV broadcast and do not include things like special box sets or sales in later years. When the data is presented in a graph, Madoka and Bake are shown as tied in first week sales thus far and that Bake's follow-on sales are not very high compared to other top-selling anime. This indicates a high possibility Madoka can meet or exceed Bake on follow-on sales.
Note: There is an anomaly with first week sales with Macross Frontier. So while it was included in the table due to high total sales, the data comparison of first week to follow-on sales is not included in the analysis.
What this data shows is aside from a couple anomalies at the extreme of low and high sales, there generally seems to be two tiers of sales for anime on the list. One is around the 79% first week sales/21% follow-on sales for anime like Bakemonogatari, K-On! and Haruhi. The other is around the 48-55% first week sales/35-42% follow-on sales of anime like Macross, Code Geass and all the Gundam series. There are many possible reasons for the variation in sales distribution between first week and later weeks for anime. However, we can conclude a few things:
- Bake had high initial sales with a modest percentage of follow-on sales to make up its total sales
- Other anime had lower initial sales but many had a higher percentage of follow-on sales.
- Of those anime, there is not a strict correlation between the number of initial sales versus sales after the first week. For instance, Mobile Suit Gundam Seed and Haruhi both had initial sales around 32-33K. However, Gundam Seed ended up with future sales of 34.47% versus Haruhi's 21%.
- There is not a correlation between years as to whether earlier or later anime tended to have a higher or lower distribution. For instance, 2006's Code Geass and 2003's Full Metal Alchemist both started around 24K in sale. However, Code Geass ended up with 42% vs. FMA's 34% in follow-on sales.
- Madoka, as of the first three volumes, has comparable initial sales to Bake, but we cannot conclude from the data as to how well it'll do in follow-on sales. We know it's unlikely that Madoka will fall below 21% or go higher than 42% but aside from that, we can't tell. We do know that Bake's 21.34% is on the modest side of gains relative to other anime, so it's quite possible that Madoka could exceed that. Based on the earlier study showing Madoka with a higher trajectory of follow-on sales for volumes 1 and 2 compared to Bake, it may be an early indication of that. However, it will likely take months of more data to determine whether this trend will continue long enough to supplant Bake as the highest selling anime in the last decade.
Manga Sales Overview
| Week 01 | Week 02 | Week 03 | Week 04 | Week 05 | Total | |
|---|---|---|---|---|---|---|
| Madoka Magica Volume 01 (Released February 12, 2011) | 14,000* | ** | 32,388 | 44,835 | 25,980 | 117,203 |
| Madoka Magica Volume 02 (Released March 12, 2011) | 31,050 | 49,166 | ** | 26,145 | 31,820 | 138,181 |
| Madoka Magica Volume 03 (Released May 30, 2011) | 159,234 | N/A | N/A | N/A | N/A | 159,234 |
| Oriko Magica Volume 01 (Released May 12, 2011) | 62,869 | 23,211 | N/A | N/A | N/A | 86,080 |
| Oriko Magica Volume 02 (Released June 12, 2011) | 61,361 | N/A | N/A | N/A | N/A | 61,361 |
| Kazumi Magica Volume 01 (Released May 12, 2011) | 59,728 | N/A | N/A | N/A | N/A | 59,728 |
| Madoka Magica Anthology 01 (Released September 12, 2011) | 28,322 | N/A | N/A | N/A | N/A | 28,322 |
| Last updated on: October 5, 2011 | *Rounded to the nearest thousand. **Numbers counted with those of the following week. |
Gallery
-
June 2011 2ch graphic is Volume 1 sales. If there's a higher selling volume, it's indicated in parenthesis.
