File:Population dynamics with varrying T.png
Jump to navigation
Jump to search
Size of this preview: 799 × 229 pixels. Other resolution: 1,200 × 344 pixels.
Original file (1,200 × 344 pixels, file size: 25 KB, MIME type: image/png)
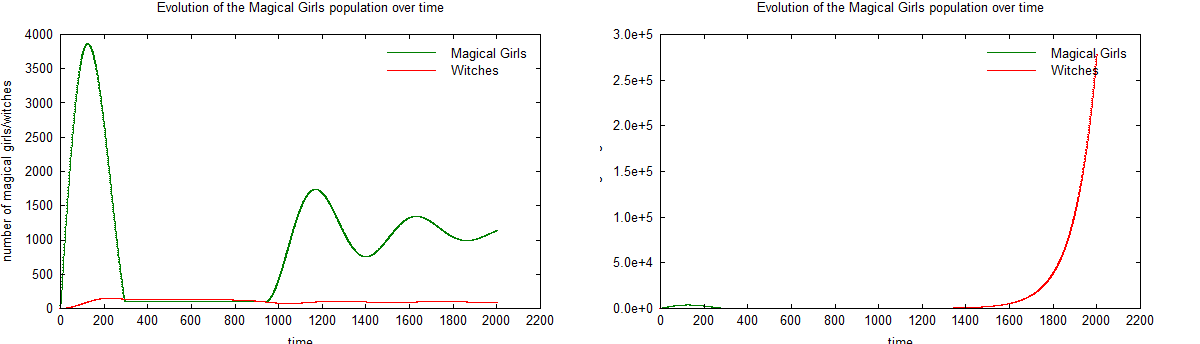
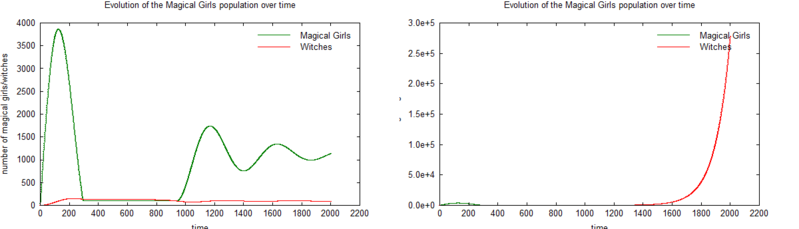
This is the third model simulated with the following values:
C = 50; % Number of girls contracted by QBe
D = 0.4; % Proportion of girls (who are fighting) that die
B = 0.15; % Proportion of girls (who are fighting) to become witches
F = 0.01; % Proportion of familiars becoming witches
K = 0.165; % Proportion of witches getting killed by MSes
P = 0.95; % proportion of MSes fightgins
Left graph is with t=0.0003595, right graph with t=0.0003596.
File history
Click on a date/time to view the file as it appeared at that time.
| Date/Time | Thumbnail | Dimensions | User | Comment | |
|---|---|---|---|---|---|
| current | 18:04, 20 March 2011 | 1,200 × 344 (25 KB) | Homerun-chan (talk | contribs) | This is the third model simulated with the following values: <pre> C = 50; % Number of girls contracted by QBe D = 0.4; % Proportion of girls (who are fighting) that die B = 0.15; % Proportion of girls (who are fighting) to become witches F = 0.01; % Pro |
You cannot overwrite this file.
File usage
The following 2 pages use this file: